The boom conditions of 2021 are over, but this does not mean a recession will be forthcoming. Amid economic uncertainty, positive actions for portfolios are recommended.

Investing amid uncertainty - building high quality portfolios
The earthquake and aftershocks that struck the world economy in 2020 have yet to pass. An unprecedented collapse was followed by a boom in economic activity, financial assets and consumer prices. These rapid and exogenous developments have left a confusing picture for investors in 2022.
As David Bailin discusses in A new world order: How should I invest now?, the tragedy of war in Ukraine has intensified the challenges of a pandemic-scarred global economy, particularly shortages and supply chain disruption. Amid the fading afterglow of last year’s boom, today’s situation requires us to allocate capital differently in a world of commodity and goods scarcity.
During the first half of 2022, rapidly rising interest rates left investors more uncertain as to how to value financial assets. The rough doubling in government bond yields in the past twelve months has restored higher quality fixed income to a more appropriate yield level for the first time in several years.
Given a slowing cyclical backdrop, we see a much more compelling opportunity in fixed income assets for both overall portfolio construction and to earn income on surplus cash – see Beat the cash thief: Bonds are Back! and Our positioning.
Unintended side-effects after the 2021 economic boom
The Federal Reserve's macroeconomic strategy has, so far, failed to differentiate a series of large exogenous shocks from the economy’s normal business cycle. Policymakers have treated both the COVID collapse and recovery with the same medicine, excessive stimulus and potentially excessive tightening. In our view, central bankers are now running their enormous monetary stimulus of 2020-2021 in reverse.
Slower growth is upon us even before the Fed raises rates again this summer. We have revised our real global GDP forecast about a full percentage point lower for both 2022 and 2023 – figure 1. Commodity shortages have – and will – restrain growth and raise inflation. But there are countervailing factors at play, too.
| 2020 | 2021 | 2022 | 2023 | |||
|---|---|---|---|---|---|---|
| Prev. | Revis. | Prev. | Revis. | |||
| China | 2.4 | 8.0 | 4.5 | 4.0 | 5.0 | 5.0 |
| US | -3.4 | 5.5 | 3.5 | 1.9 | 2.6 | 2.0 |
| EU | -5/9 | 4.8 | 3.9 | 2.3 | 2.4 | 1.8 |
| UK | -9.7 | 6.0 | 4.2 | 3.0 | 2.5 | 2.0 |
| Global | -3.2 | 5.6 | 3.8 | 2.6 | 3.5 | 2.7 |
Source: Haver and Office of the Chief Investment Strategist, as of 18 May 2022. All forecasts are expressions of opinion, are subject to change without notice, and are not intended to be a guarantee of future events.
We see an ongoing supply recovery and incipient demand slowdown leading to a gradual deceleration of inflation over the coming year. In time, slowing consumer demand, inflation and employment argue for central banks to swerve from a path of excessive tightening that leads to recession. With significant risks in mind, we have altered portfolio allocations over the past year to focus on higher quality income-generating assets and the economy’s essential needs – see Our positioning and figure 2.
Figure 2. Durable demand, equity resilience
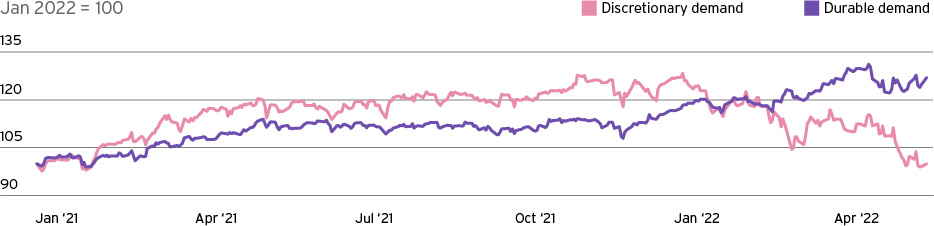
Chart shows performance of “discretionary” and “durable” demand industries. Discretionary demand industries are household durables, specialty retail, textiles, apparel & luxury goods, residential REITs, hotels, restaurants & leisure, financials and airlines. Durable demand industries are food, beverage & tobacco, energy, utilities, healthcare, telecommunication services. Source: Haver Analytics and Bloomberg as of 15 May 2022. Past performance is no guarantee of future returns. Real results may vary. Indices are unmanaged. An investor cannot invest directly in an index. They are shown for illustrative purposes only.
Too much 2020-21 stimulus, withdrawal symptoms now
In response to the deep but short-lived economic effects of the pandemic, fiscal and monetary policymakers applied unprecedented stimulus. Targeted financial support, say, for the airline and hospitality industry and its workers would not have generated the unsustainable demand boom that the massive support for nearly all consumers did. Now, in fighting pandemic-impacted shortages – mismatches in supply or demand that need to be resolved at a sectoral level – policymakers are applying macro-level economic restraints – figure 3.
Figure 3. Declining stimulus, fading boom
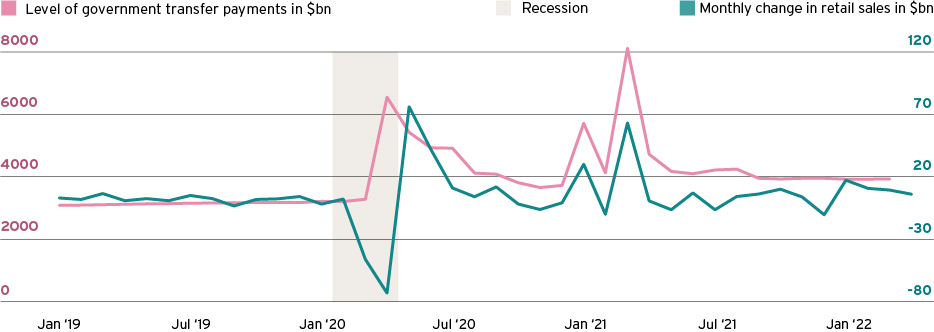
Chart shows month-on-month changes in US government transfer payments of income and retail sales. Source: Haver, as of 15 May 2022.
History suggests monetary policy has never resolved supply shocks. The Fed regulates demand, but does not produce goods and services. The demand support provided to economies in 2020-2021 is waning fast. In the first quarter 2022, US federal spending fell 33%. A 250-basis point rise in mortgage rates is just one example of the Fed’s blunt force to slow the housing sector – figure 4.
Figure 4. Surging mortgage rates, sinking home loan applications
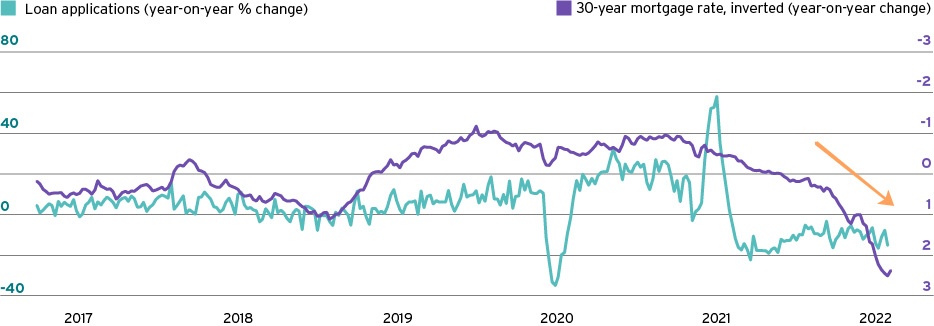
Chart shows the inverted 30-year US mortgage rate and home loan applications. Source: Haver, as of 15 May 2022.
Consumer spending is likewise decelerating over the course of the first quarter. In time, we expect this to slow employment and inflation – figure 5.
Figure 5. Where consumer spending goes, labor follows

Chart real percentage change in consumer spending pushed forward six months, with percentage change in private employment. Source: Haver, as of 15 May 2022.
The Fed was previously unmoved by the argument that monetary easing was excessive in the boom year of 2021. But, the central bank’s views have changed markedly in 2022. As the Fed begins a period of more rapid monetary tightening, we recall Chairman Powell’s words of last August: The main influence of monetary policy on inflation can come after a lag of a year or more. If a central bank tightens policy in response to factors that turn out to be temporary, the main policy effects are likely to arrive after the need has passed.
At some point – ideally during 2022 – we would hope the Fed will recognize the future impact of its rate hikes and reduced lending (quantitative tightening
). If recognized early enough, this would preserve the chance of continued expansion and perhaps not require a policy reversal from the Fed. Conversely, the US and global economy are unlikely to sustain growth through another year if the Fed continues with its projected rapid monetary tightening deep into 2023.
The Fed has not managed to end recessions quickly once underway. However, it does have a history of frequent policy reversals. In the past 45 years, the Fed has sustained its maximum policy rate for only seven months on average before cutting rates. In 2019, the Fed cut rates 75 basis points when it expected to raise rates 75 basis points that year. (It also ended quantitative tightening early at an emergency meeting.)
If the Fed can soon strike a balance between the excessive easing of 2021 and the rapid tightening it has rhetorically
encouraged in 2022, it might avoid amplifying financial and economic excesses. In the meantime, with the US bond market seeing yields rise nearly 200 basis points across nearly all maturities and categories, we believe the risk/reward potential for bond investors has improved markedly – see Beat the cash thief: Bonds are back!
In early 2022, US long-term Treasury returns have fallen as much as 35% from their previous high, an historic record loss of value. As we do not believe inflation will rise 2% per year every year into the future, we have added an overweight to long-duration US government bonds for the first time since yields bottomed in 2020. Cheaper, high-quality bonds now deserve a larger allocation in many types of portfolios.
Wages accounted for very little of the post-COVID inflation spike – figure 6. That’s why a recession causing millions of job losses in 2023 would be a massive sacrifice that would do very little to slow inflation.
Figure 6. Inflation surged largely on goods shortages, not wages
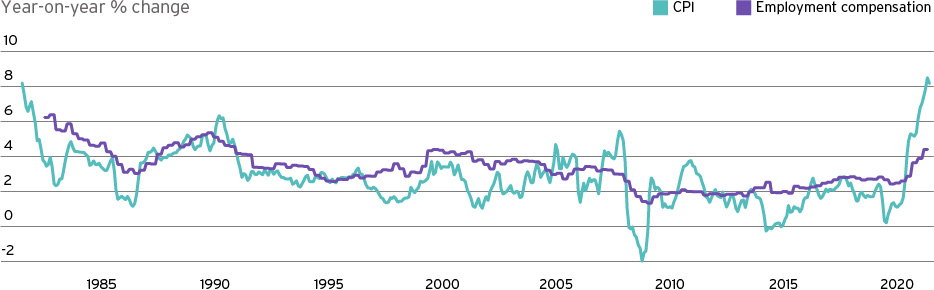
Chart shows the year-on-year percentage change in employment costs as measured by the Employment Cost Index: Civilian Workers, and the year-on-year percentage change in the CPI-U; All Items inflation index. Source: Haver, as of 15 May 2022.
Patience, please!
Fortunately, rapidly growing global production is outstripping demand growth. This can be seen in the recovery of business inventories from record low levels. We believe this is sowing the seeds of lower inflation without an employment collapse, with goods imports now surging to meet demand. In other words, market forces – rather than tightening – are gradually doing what is needed to rebalance supply and demand. What central banks need to do is allow for a full year of such recovery.
To date, the Fed has raised rates a mere 75 basis points in 2022. Quantitative tightening is soon to come. This has been painful for financial markets, but not yet too much for the expansion to bear. However, the Fed is widely expected to tighten another 250 basis points in the next 18 months. If the Fed must wait for lagging economic indicators to weaken – instead of looking ahead to policy’s impact a year or more
into the future – the probability of a new recession will only increase. We place a 35% likelihood on this.
Engineered recessions
Recollections of 1980 and 1982 may be dim. The recession of 1982 was particularly painful by the standards of the time. However, when the Fed has deliberately engineered recession, the economy’s ability to return swiftly to full potential has been notable – figure 7. In some ways, the impact is engineered,
although not as benignly as the very temporary economic shutdown of the second quarter of 2020 to stem the pandemic. Similarly, we would expect China’s economic recovery to resume when COVID restrictions are lifted – see The rise of Asia – G2 world accelerated.
Figure 7. US growth has often rebounded rapidly from recessions

Chart shows quarterly changes US real GDP in recessionary and post-recessionary periods (Period 0= recession start). Source: Haver, as 18 May 2022.
Such recessions differ markedly from contractions where large parts of the economy have been booming, with big imbalances to work off. The clearest economy-wide example was the housing excesses in 2008-2009.
To date, banking sector leverage has remained historically moderate in the aftermath of the Global Financial Crisis. That said, there are some systemic risks beyond traditional banks – figure 8.
Figure 8. The rise and fall of US growth equity valuations
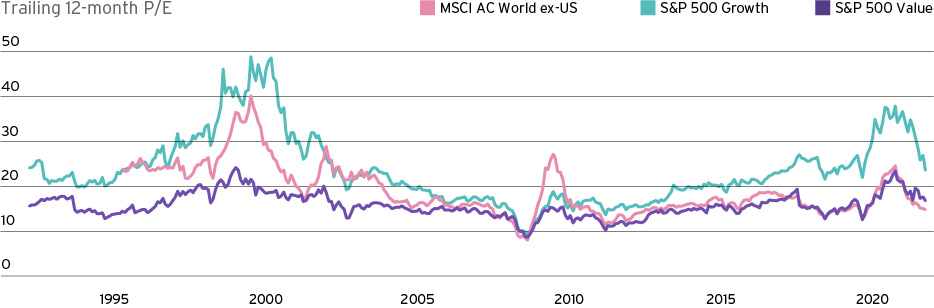
Chart shows US growth, value and non-US equity trailing price/earnings multiples. Source: Haver as of 15 May 2022. Past performance is no guarantee of future returns. Real results may vary. Indices are unmanaged. An investor cannot invest directly in an index. They are shown for illustrative purposes only.
This is one remaining strength for the economy facing sharp policy tightening. Still, the boom in speculative tech valuations in 2020-2021 does bear some resemblance to the 1995-1999 period, and the unwind that followed – figure 9.
Figure 9. Tech spending looks more resilient today

Chart shows year-on-year real private nonresidential investment in information processing equipment. Gray shaded zones denote US recessions. Source: Haver Analytics, as of 30 Mar 2022
Technology shares will rise again
Technology valuations in recent years may somewhat resemble those of the late 1990s, tech profitability does not. There is less concentration in tech spending today. While late 1990s firms had the internet boom
in common, firms such as Tesla and Meta today have very little business in common.
While time will tell, we do not see technology spending as about to retreat – figure 9. In 2000-2002, fundamental excesses in technology – such as the massive buildout in dark fiber
communications networks – resulted in excess capacity and a tech-led economic contraction. Today, discretionary consumer spending is likely the economy’s most vulnerable component, and only while rapid inflation lasts.
Investment strategies amid scarcity
We have shifted our tactical asset allocation to reflect a tragic new world of scarcity – see Our positioning. Without speculating as to how and when hostilities might end, the futures prices of a widespread basket of natural resources exported by Russia and Ukraine have risen sharply over the two-year delivery period ahead – figure 10.
Figure 10. High but potentially easing: Select energy, metals and food commodities

Chart shows a basket of Brent crude oil, wheat, German natural gas and steel futures, comprised of futures contracts with delivery through 2024, are equal weighted and indexed to Feb 2023; the day before the start of the war was set to 100 for each asset. Source: Haver Analytics and as of 15 Apr 2022. Note: All forecasts are expressions of opinion and are subject to change without notice and are not intended to be a guarantee of future events. Past performance is not indicative of future returns. For illustrative purposes only.
The loss of key agricultural inputs and outputs from the region will have painful consequences for much of the emerging world, where foods comprise much larger shares of household budgets. The answer to this is higher production everywhere possible. We have made significant allocations to global natural resources firms at the expense of other equity sectors and regions such as Europe.
Fortunately, commodities are far from the most powerful determinant of end-consumer prices even for closely aligned products – figure 11. In the slowing demand environment we expect, high commodity prices will simply displace profits and sales of more discretionary merchandise. While our commodity equity and quality US fixed income overweights seem contradictory, the supply shock of lost Russian and Ukrainian exports is a source of slower global growth. If supplies recover and commodity prices fall, we would expect a stronger economic outlook and potential benefits for broader global equity markets.
Figure 11. Producer prices: Only one ingredient of consumer prices

Chart shows CPI and Core Crude Materials same scale year-on-year %. Source: Haver Analytics, as of 18 May 2022.
Less stimulus does not mean less innovation
Despite the market value of innovation being under pressure, we think there are key differences with past episodes. In particular, we do not believe the world is about to reduce expenditures in such areas as cybersecurity and green tech – see Unstoppable trends. This contrasts with the end of the dot-com
bubble in the early 2000s, when both valuations and fundamentals unwound together.
Like some the most speculative ventures of the past year, the Nasdaq Composite Index lost 78% of its value in just over two years through mid-2002. Subsequently, it returned more than 1000% in the next 20 years. Why? Because even during the tech collapse of 2000-2002, growth-creating technological progress took shape – figure 12.
Figure 12. Tech-oriented equities and inventions’ upward march
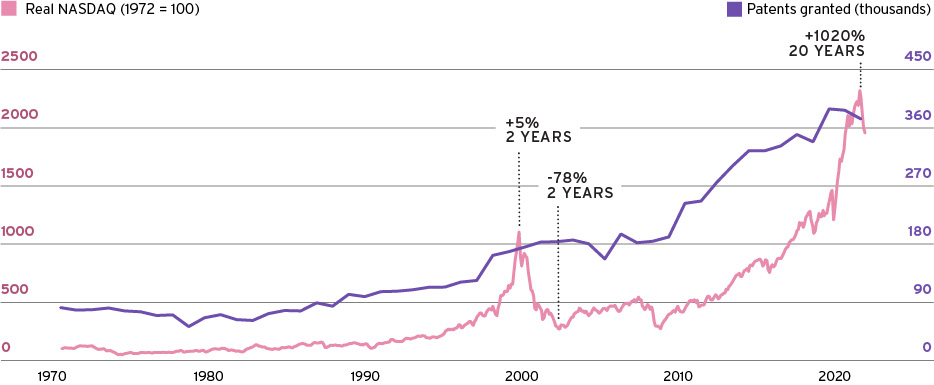
Chart shows the inflation-adjusted Nasdaq Composite Index price and US patent grants since 1971. Source: Haver Analytics, as of 18 May 2022. Past performance is no guarantee of future returns. Real results may vary. Indices are unmanaged. An investor cannot invest directly in an index. They are shown for illustrative purposes only.
Innovations of that bear market period included predecessor of the iPhone and today’s electric vehicles, the sequencing of the human genome and the establishment of today’s private space industry.
The largest firms of the equity bubble period traded at 78 times earnings at the peak of the 10-year economic expansion before the collapse. Some were absorbed by competitors, while others never recovered their peak value. But an investor who had bought them all near their 1999 peak and held them through today would have still beaten cash by 290 basis points per year – figure 14.
Figure 14. Buying big tech at the bubble peak still beat holding cash over time

Chart shows the total returns from “tech bubble equities,” the S&P 500 Index, the MSCI Global AC World Index and cash between the end of 1999 and March 2022. Past performance is no guarantee of future returns. Real results may vary. Indices are unmanaged. An investor cannot invest directly in an index. They are shown for illustrative purposes only. See Glossary for definitions.
We are not arguing for some imminent new concentration holding in growth shares. However, at a time when markets are not delivering immediate positive returns, the foundations of future returns are at least being laid.
How to invest amid uncertainty
Amid heightened uncertainty, investors often find themselves frozen with fear. The resulting portfolio inaction can prove costly. Two of the most common mistakes are retaining a portfolio positioned for conditions past and holding excess cash.
Our goal is to build quality, resilient portfolios for today’s environment. Citi Global Wealth Investments has already made important adaptations in our tactical asset allocation in 2022. These include an overweight position in natural resources and oil services equities – see Our positioning.
Amid scarcity and supply shocks, we think these assets may help reinforce portfolios – see also Overcoming supply shortages.
We reiterate our conviction in a broad range of high-quality assets. Among equities, these include long-term leaders – companies with a variety of quality characteristics – see Time to follow the long-term leaders in Outlook 2022. Examples include dividend growers – see Beat the cash thief! – and many equities related to our Unstoppable trends – see Digitalization and the Rise of Asia. Another of our key calls focuses on high quality fixed income. With yields having risen significantly in 2022, we see greater potential in this asset class – see Beat the cash thief: Bonds are back.
The first positive action you should consider though, is to request your personalized Outlook Watchlist from your relationship team. This report compares your portfolio to suggested allocations. We can then discuss ways for you to bring the two into alignment.
OUTLOOK
Mid-Year Wealth Outlook 2023
While our asset allocation strategy remains defensive, investors should consider staying invested and modify portfolios over time.

Contact us
To help put you in touch with the right Private Bank team, please answer the following questions.