Investing in bonds
A difficult start to 2022 fixed income has driven up yields in this asset class. We believe this has created potential income-seeking opportunities.

A difficult start to 2022 fixed income has driven up yields in this asset class. We believe this has created potential income-seeking opportunities.
Early 2022 was a lousy time to be a fixed income investor. The asset class suffered one of the worst total return periods in its history, with the Bloomberg US Aggregate Bond Index down 9.5% year-to-date as of 23 May 2022.
Monetary policy was the primary reason for this sharply negative performance. In early January, the US Federal Reserve suddenly pivoted away from its plan for measured and controlled tightening. Instead, the Fed signaled a much more aggressive – almost emergency-type – approach to combat the risk of persistently high inflation that it perceived.
Given the lack of a decline in inflation readings so far this year, combined with the commodity price shock
imparted by the Ukraine conflict, the Fed has felt compelled to continually talk rates
higher. This is in addition to its initial 25 basis point (bp) rate hike in March and a 50bp hike in May. The futures market is now pricing almost eight more 25bp rate hikes in 2022 and a couple more in 2023. The Fed also announced that as of June, it will begin reducing the size of its near-$9 trillion balance sheet up to a cap of $95bn a month by the end of the summer, a process called quantitative tightening
(QT).
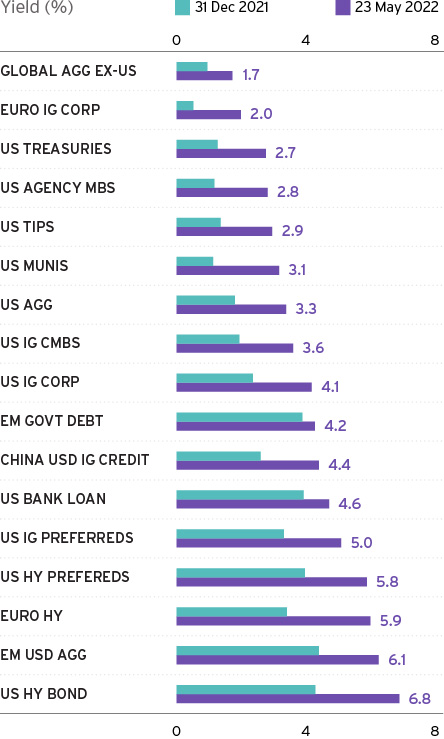
Short-term US Treasury yields ratcheted up mechanically alongside monetary tightening expectations. As those yields rose, longer-term US Treasury yields and credit yields rose worldwide. The price of near cash
instruments increased almost 200 basis points (bps) in four short months, a record move that reverberated through every fixed income class – figure 1.
Our view is that most of the expected US tightening is now embedded in Treasury yields. We believe it is possible that rates will peak this year, as US GDP growth decelerates rapidly. In turn, this will likely see reduced inflation readings, perhaps allowing the Fed to relax its hawkish stance.
For investors, these higher yields may represent an attractive level at which to buy. We believe certain fixed income assets now offer an antidote
to the cash thief,
given their higher yields.
What is more, such assets may also help mitigate equity risk within a diversified portfolio. Historically, long-term US Treasuries are one of the few assets with a negative correlation to equities during large equity corrections – figure 2. However, we emphasize the need for selectivity here. Neither long-dated European and Japanese government securities nor risky credit
have the same historical hedging properties. This is due to more active central bank intervention in those regions and because risky credit
returns tend to track equity returns.
| Date of drawdown | Mar '01 | Jul '08 | Mar '20 | Avg |
|---|---|---|---|---|
| # of days | 251 | 197 | 17 | 155 |
| US TREASURY | 12.4 | 7.6 | 4.3 | 8.1 |
| UST SHORT | 9.1 | 5.1 | 1.5 | 5.2 |
| UST INTERMEDIATE | 12.6 | 8.4 | 31.1 | 8.1 |
| UST LONG | 14.8 | 9.4 | 10.7 | 11.7 |
| US IG CORP | 12.4 | 2.2 | 4.0 | 3.5 |
| US IF CORP SHORT | 9.9 | 3.9 | 0.7 | 4.4 |
| US IG CORP INTERMEDIATE | 12.4 | 3.2 | 2.4 | 4.4 |
| US IG CORP LONG | 13.2 | 0.4 | 7.0 | 2.2 |
| US HY CORP | 7.6 | 4.4 | 10.8 | 7.6 |
So, which are the fixed assets that we see as most appropriate to help beat the cash thief?
The yield on investment grade bonds – as represented by the Bloomberg US Corporate Bond Index – had risen to 147 basis points above those on US Treasuries by 23 May. This spread is well up from its year-to-date low of 91bps on 5 January.
This swift spread widening likely resulted from uncertainty over the Ukraine conflict and the direction of the US economy. These higher yields are certainly certainly welcome for new investors – since in addition to Treasury yield increases – the overall spread level is now almost double to its multi-decade low of 76bps in 2005 – figure 3. Further spread widening may be limited absent a further increase in risk aversion.
We continue to favor intermediate IG for seeking income to help offset inflation, while also providing a potential hedge should equities decline.
US municipal bonds or munis
– debt issued by states, cities and other government entities to finance public projects –look appealing for investors who can take advantage of favorable tax treatment.
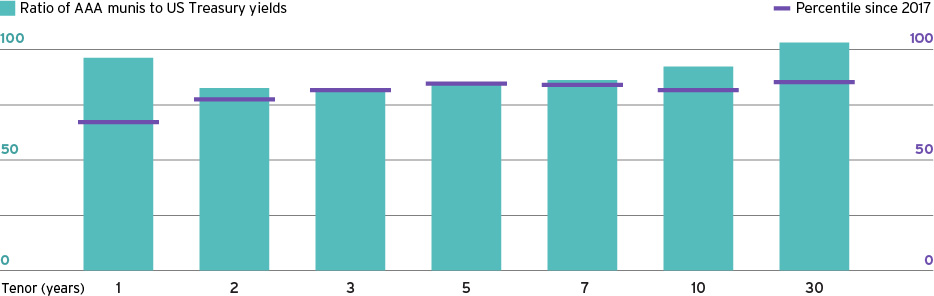
The muni yield/Treasury yield ratio (M/T ratio) compares the yield on AAA-rated municipal bonds to the yield on the same maturity Treasury. Currently, munis are favorably valued versus Treasuries at all maturities by past standards. As of 23 May, the 5-year M/T ratio stood at 89%, up from 45% on 3 January. The 10-year ratio has risen from about 70% to 100%. Most other M/T ratios are near the top quartile of their 5-year historical highs.
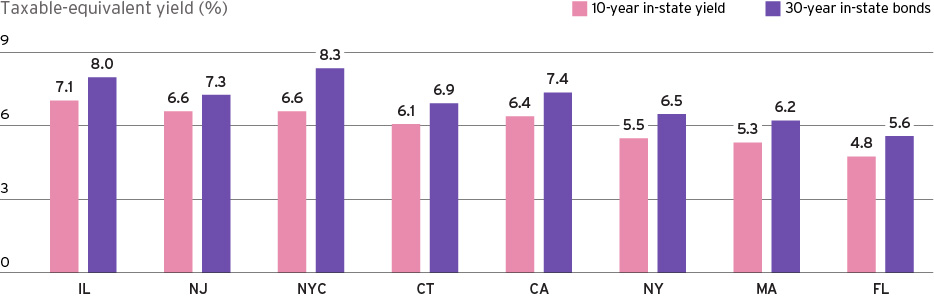
The value of this ratio is indicated by the high tax-equivalent yields that can be obtained – figures 4 and 5. Additionally, credit ratings for most munis are as robust as we have ever seen. The metrics for US states – some of the largest munis issuers – are improving thanks to very strong tax revenues.
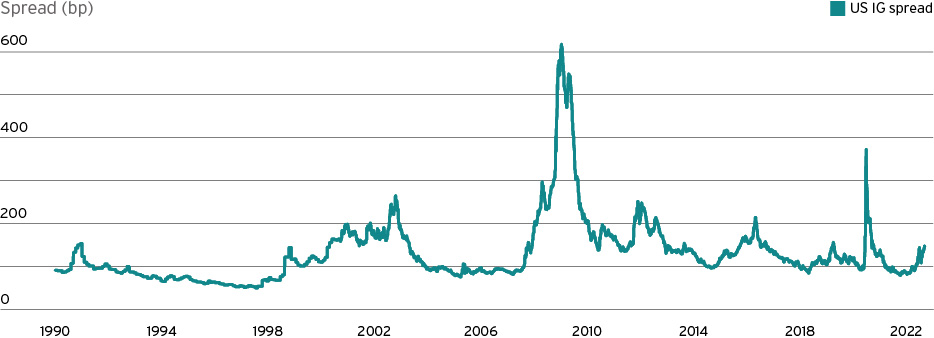
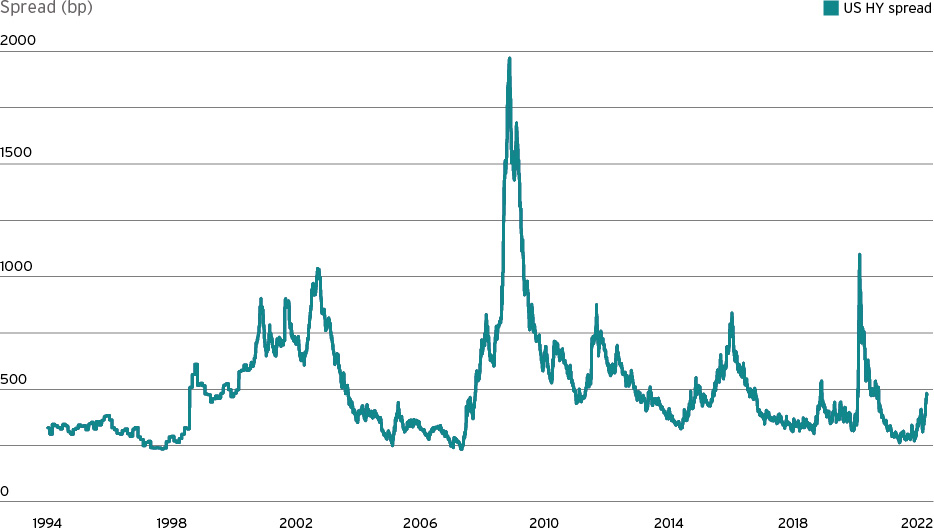
Investment grade bonds may be entering yield and spread ranges that are nearer to past averages. By contrast, high yield (HY) spreads now exceed their 5-year average pre-pandemic levels of around 440bps. As of 23 May, they stood at 475bps – figure 6. HY spreads may have further to widen if concerns about the US economy intensify.
HY credit metrics overall have improved since the pandemic because of higher product prices creating a sort of windfall revenue,
allowing many companies to pay down their debt quickly. This is especially true in energy, which represents about 13% of the HY sector.
In addition, many companies’ assets have appreciated, such as retailers that own real estate. Others have seen the replacement cost of their fixed assets have increased due to inflation, such as auto producers. This has improved debt-to-asset metrics.
However, as the Fed raises rates, corporate financing costs will increase. Since HY companies are generally more leveraged than IG companies, higher rates will consume more of their free cashflow over time. And if the economy slows, such issuers’ top-line revenues might decline as well. Nevertheless, we see a place for select higher-rated HY bonds or loans in suitable investors’ portfolios.
Preferred securities and other contingent capital
securities sit near the bottom of an issuer’s capital structure, below unsecured debt and just above equity. These securities are generally fixed-to-float.
This means they offer fixed rate for a certain period, often five years. After that, they generally switch to floating rate plus a credit spread. At the end of the fixed period, most issues are callable, i.e., the issuer can return the investors’ principal and cease making interest payments.
Most of preferred securities are perpetuals,
such that they never mature unless called. By contrast, some issues mature 30 to 50 years after issuance. Given their relatively short-fixed rate period and then switch to floating rate, preferreds have very low duration, despite their long maturities. Conventional wisdom holds that most issuers will generally choose to call the securities at the end of the fixed period if rates are rising, but they are not required to do so.
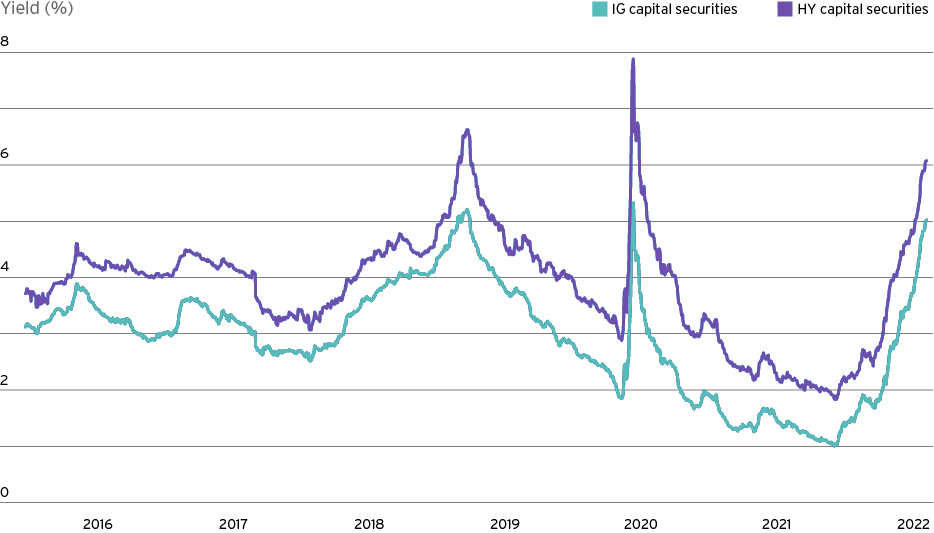
Similar to other fixed income assets, preferreds have dropped meaningfully in price in 2022. At present yield levels – IG preferreds at 5.76% and HY preferreds at 6.54% as of 23 May – these securities may be interesting for investors who want shorter-duration – less than four years’ – fixed income exposure and are comfortable with both the credit risk, and the “extension risk” of the preferred structure – figure 7. For US taxpayers, there may be favorable tax treatment on the dividend income for certain preferreds as well. This can translate into taxable-equivalent yields of between 6 and 7% or higher, depending on the issuer.
Emerging markets (EM) US dollar-denominated debt is a very broad category. It encompasses both IG and HY debt, as well as sovereign and corporate issuers in both rating categories. They are influenced by country, regional and industry sector considerations. Idiosyncratic
developments can also arise, which can have major valuation impacts on a particular sector or country’s US dollar denominated debt, such as what recently occurred to issuer countries involved with or geographically near to the Ukraine conflict.
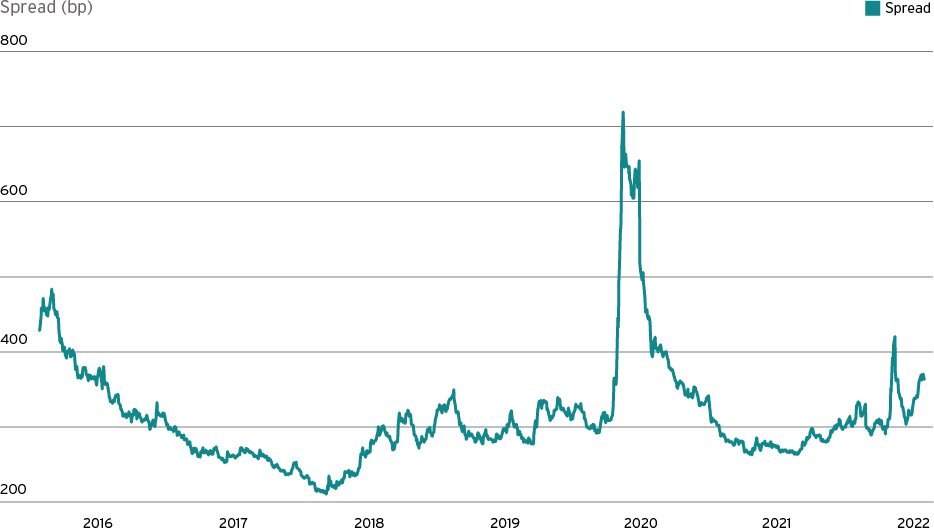
Overall, spreads in EM are trading at 364bps as of 23 May and near the top of a multi-year channel– excluding the COVID pandemic period – figure 8. With Russia removed from the index, yields are not as high as they were a few weeks ago. However, given the blend of rating, industry, and geographic diversification, this may be one of the best values in fixed income currently.
One of the considerations for EM countries and companies currently is that higher US Treasury rates can lead to a stronger US dollar, which in turn may cause balance-of-payment issues, as imports become more expensive. However, in many EM regions and countries local currencies have held up vs the US dollar, as many of them are large commodity exporters and expected to benefit from higher commodity prices which are priced in US dollars.
The speed and extent of the fixed income moves in 2022 so far has taken many by surprise. As such, many portfolios still reflect the lower yield environment of late last year. At that time, many more bonds were at risk of the cash thief’s activities. We believe investors should now review their fixed income allocations in light of the higher yields now available.
On a tactical view, our Global Investment Committee is overweight intermediate Treasuries and Investment Grade, slightly overweight long-term Treasuries, underweight in European and Japanese government securities, neutral in High Yield and overweight in Emerging Markets.
Going forward, we would expect to add to longer-term duration as the Fed’s actions on tightening become clearer. We will likelier add more credit risk once the effects of this tightening are absorbed by the economy.
If we have underestimated the extent of likely yield increases, however, fixed income assets may suffer further losses. However, we have high conviction in our view that rates will peak in 2022.
While the cash thief remains on the prowl, there are more possibilities now within fixed income to help seek to defend your portfolio from his exploits.
While our asset allocation strategy remains defensive, investors should consider staying invested and modify portfolios over time.

To help put you in touch with the right Private Bank team, please answer the following questions.